
Environmental and Geo-Information Management
About the program
At this study program, you learn to organize and evaluate environmentally relevant data by means of solid IT skills and comprehensive knowledge of application-oriented software tools. Visualization of spatial data to communicate results is important for the successful implementation of environmental projects.
In addition to the programming languages Java, JavaScript and Python, the modules of the computer science and data science area also include building blocks for identifying, organizing and analyzing Big Data in the environmental and geospatial fields.
In the field of geoinformation technology, we focus on the use of a wide variety of sensors to collect spatial environmental and geodata at different scales. In addition to IT-supported analysis, geo-visualization for user-friendly communication plays an important role in the implementation of environment-related projects.
The environmental applications field is based on two theory modules: Earth and Climate, as well as Ecology, which provide the necessary basic knowledge. Continuing from there are modules on environmental monitoring and environmental modeling, which bring concrete environmental applications into practice based on the computer science and geoinformation technologies taught.

Basic studies
| First semester (basic studies) |
|---|
| Earth and Climate |
| Fundamentals of Geo-visualization |
| Fundamentals of Geodata |
| Computer Science Basics |
| Mathematics 1 |
| Second semester |
|---|
| Ecology |
| Geo-Visualization |
| GraphDV/Digital Image Processing |
| Computer science II |
| Mathematics 2 |
Advanced studies
| Third semester |
|---|
| Environmental Monitoring I |
| Data Science |
| Basics of Geoinformation Systems (GIS) |
| Photogrammetry |
| Computer Science III |
| Sixth semester |
|---|
| Mobile Map Apps |
| Environmental Modeling |
| Big Geodata |
| 3D Visualization |
| GIS Programming |
| Fourth semester |
|---|
| Environmental Monitoring II |
| Geodata Management |
| GIS applications |
| WebMapping |
| General Qualifications 1 |
| Seventh semester |
|---|
| Project Climate-Energy-Resources |
| General qualifications/Foreign language |
| Thesis |
| Fifth semester |
|---|
| Internship semester |
| Thesis |
|---|
The great variety of topics available for the bachelor’s thesis becomes clear in this overview |
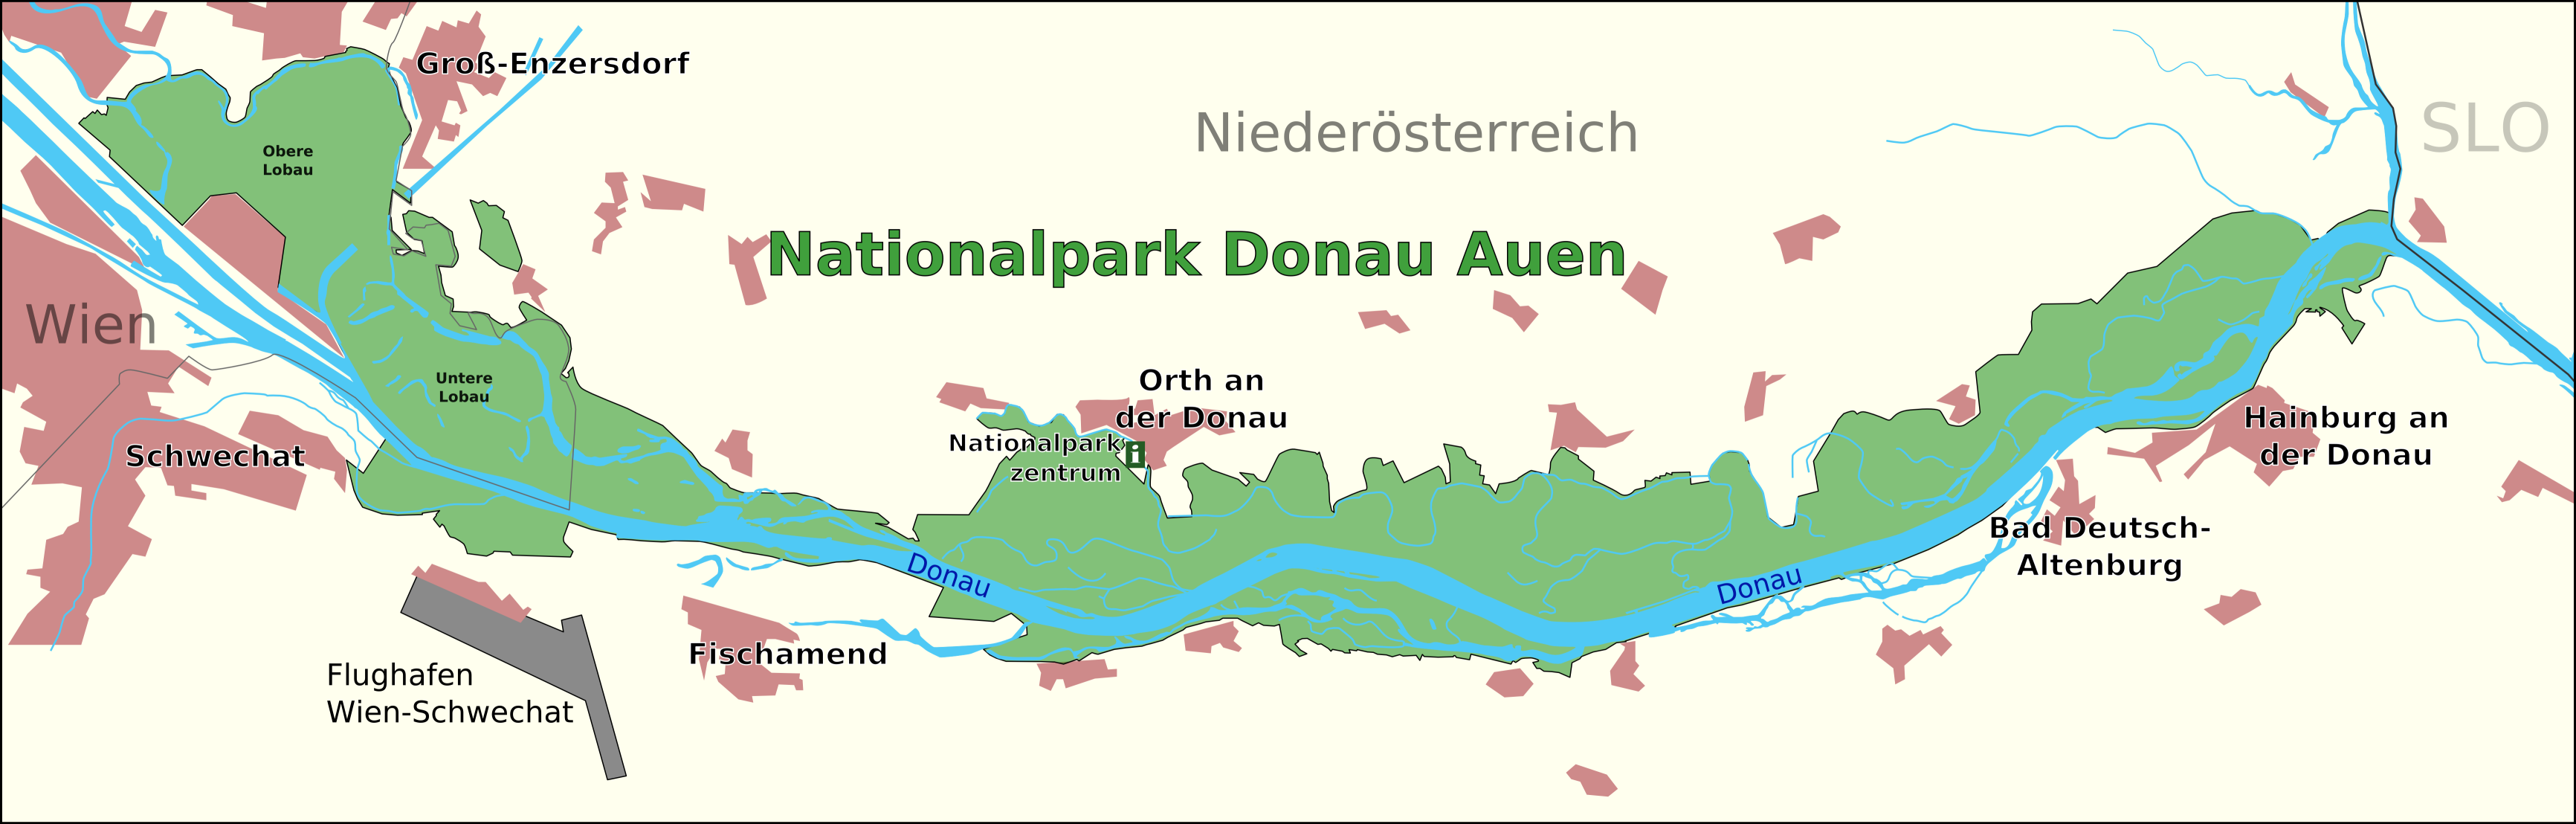
Excursion to the Danube National Park with drone flights
As part of the course "Photogrammetric Evaluation" in the 3rd semester of the Bachelor's degree program "Environmental and Geoinformation Management", an excursion to the Danube Floodplain National Park "Free River - Wild Forest" east of Vienna was carried out from 23.10.23 - 28.10.23 (see also).
Examples of projects: Student theses
StoryMap
The new technology of "StoryMap" combines web page content to interactive maps. In this way, complex, spatial issues can be visualized in an attractive way.
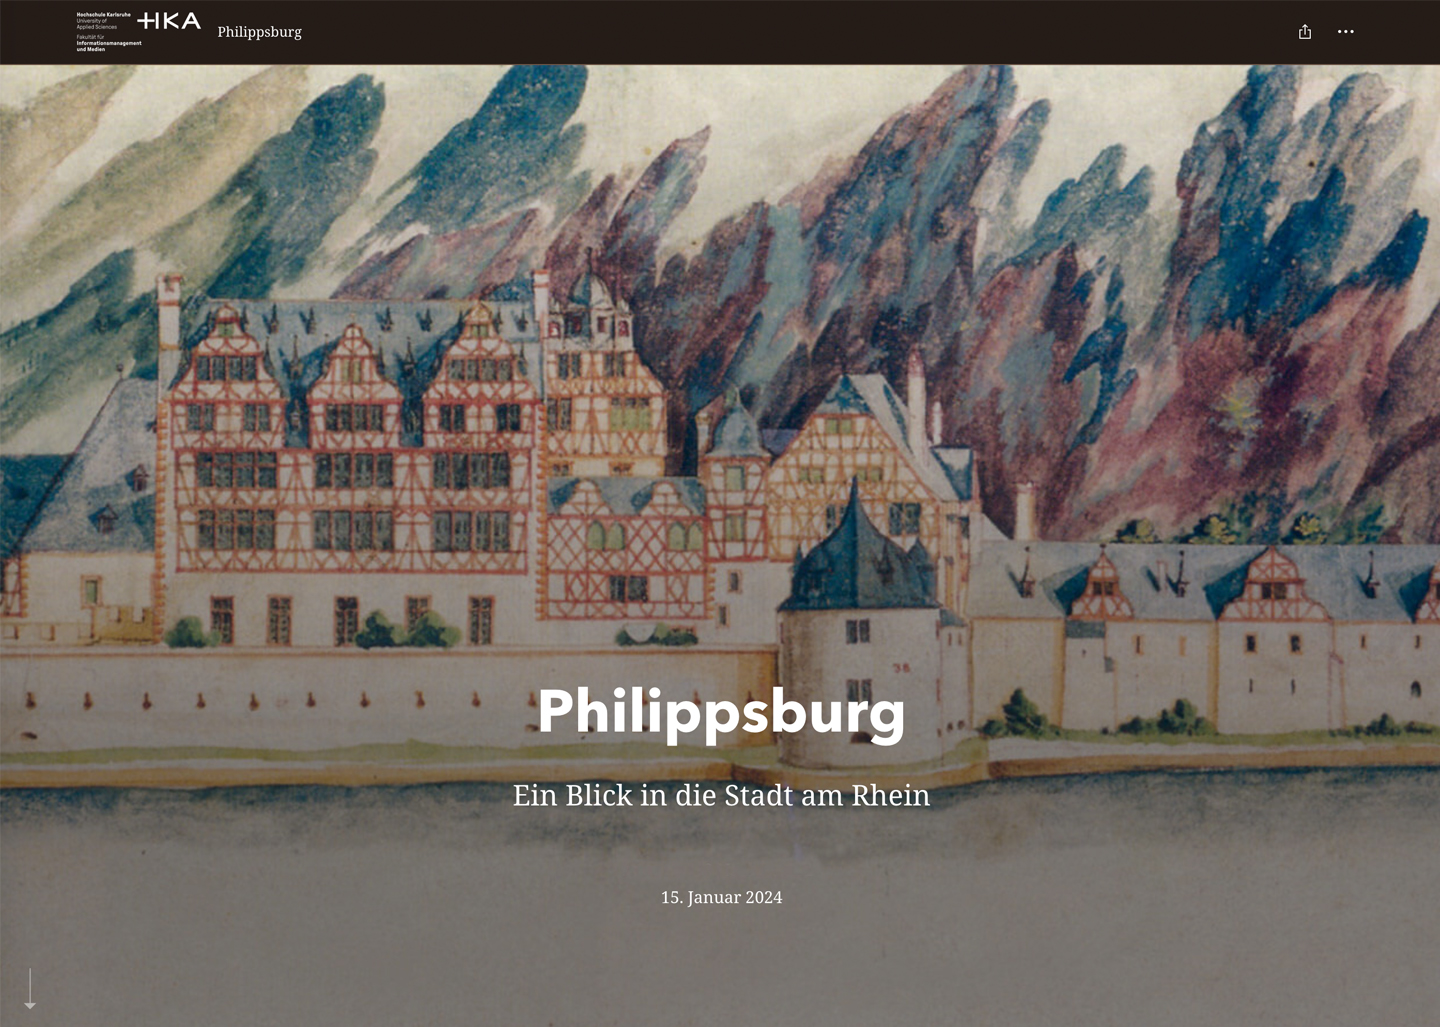
Example: Historical development of Philippsburg
Lecturer: Prof. Detlef Günther-Diringer
Course: Spatial visualisation
Environmental monitoring via satellite image analysis
Satellite images offer exciting views of our earth. Since image data from Landsat or Sentinel have been made freely available, their importance and use is growing rapidly. In the module Image Analysis, students gain practical experience in the analysis of multispectral satellite images. The example shown concerns the Kingwal swamp in western Kenya, which is decreasing in size. Landscape change can be highlighted and evaluated using satellite imagery.
Lecturer: Prof. Gertrud Schaab
Participants: students - Environmental and Geo-Information Management
More information


Real-time cartography on earthquakes
As part of the project in the final, seventh semester, students created the interactive web map application on current earthquakes. The real-time data is retrieved, processed, managed in databases and implemented in a web interface in an automated way.
Participants: students - Environmental and Geo-Information Management
Energy master plan
This thesis shows possibilities to visualize the energy master plan of the city of Karlsruhe in a three-dimensional way. In different study projects, partial aspects of the energy master plan of the city of Karlsruhe were developed.


Insect extinction
This thesis describes the development of a GIS-based method to evaluate the attraction effect of artificial lighting on insect fauna in protected areas. In cooperation with the Regierungspräsidium (regional council), the environmental office of Karlsruhe and the Stadtwerke Karlsruhe (public services), this project was exemplarily implemented at the nature reserve "Alter Flugplatz Karlsruhe" (disused airfield).
GIS applications
In the second module on Geographic Information Systems (GIS) the focus is on the applications: Water runoff starting from a digital terrain model, determining suitable pipeline routes based on a cost surface that takes several factors into account, supplying restaurants based on a routable road network, and creating a map service that can be accessed on the Internet to visualize statistical data.


3D Visualization
Berckholtzsches Palais (formerly Karlstraße 44): 3D design with "Autodesk 3D Max" in Level of Detail 3 (accuracy 10-20 cm) and presentation via video animation (Alicia Schneider).
Lecturer: Prof. Detlef Günther-Diringer
Participants: students - Environmental and Geo-Information Management
For more information, see the video
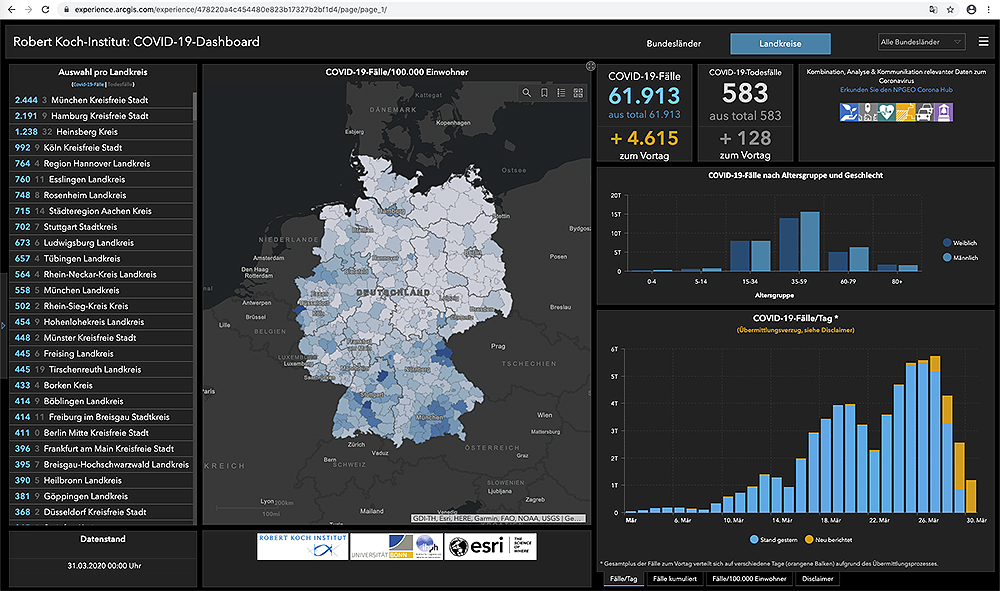
The Robert Koch Institute (RKI) uses geographic information technology to visualize spatial data
The technology behind the RKI dashboard will be applied in our study course. We are one of the few study courses in Germany that has been recognized as an EDC - ESRI Development Center. ESRI, the world market leader in this technology, offers comparable visualizations for Germany in which the corona statistics are updated down to the district level.

Cartography and Geomatics
Key content from the former Cartography and Geomatics bachelor's program has been integrated into the visualization modules of the Environmental and Geo-Information Management program.
