FOR5134: Solidification cracks in laser beam welding: high-performance computing for high-performance processes - microstructure simulation of solidification in the weld seam
Motivation
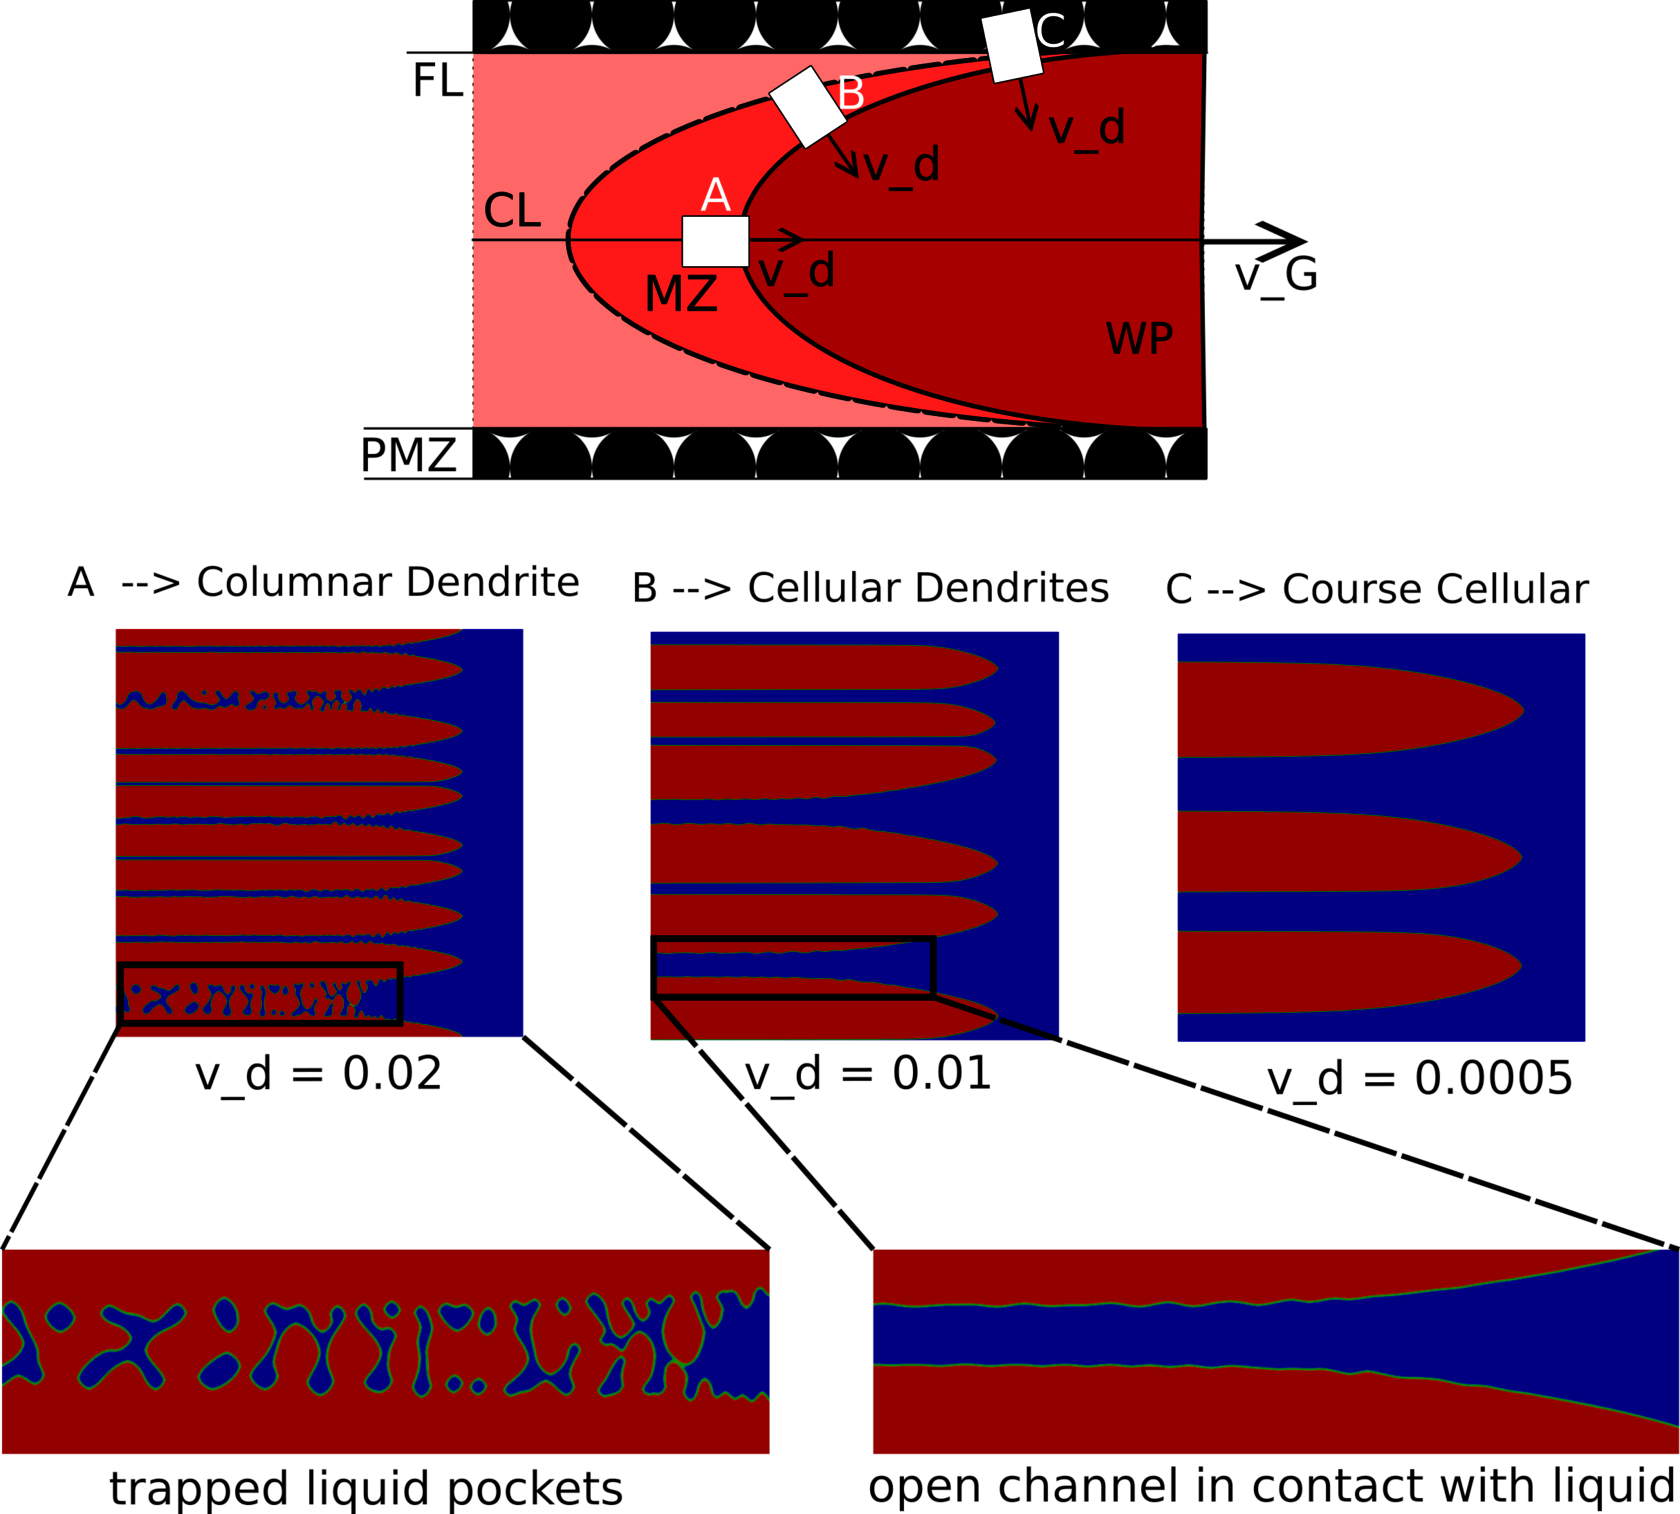
Laser beam welding is a state-of-the-art joining process that uses a highly focused beam of light to fuse materials with exceptional precision and efficiency. It is characterized by its ability to produce precise, repeatable and high-quality welds through automated processes in various sectors such as automotive, aerospace, Medical Systems and Electrical Engineering. When welding austenitic stainless steels using laser beam welding, various challenges such as hot cracking can occur due to the unique properties of these materials and the extreme thermal conditions. The complex interplay between solidification kinetics, alloy composition, cooling rates and phase transformations during welding significantly influences the microstructure and mechanical properties of austenitic stainless steels. Understanding these factors during dendritic solidification at the microscale, as illustrated in Figure 1, is critical to mitigating hot cracking and micro-segregation effects that can affect the mechanical performance of welded components.
Objectives
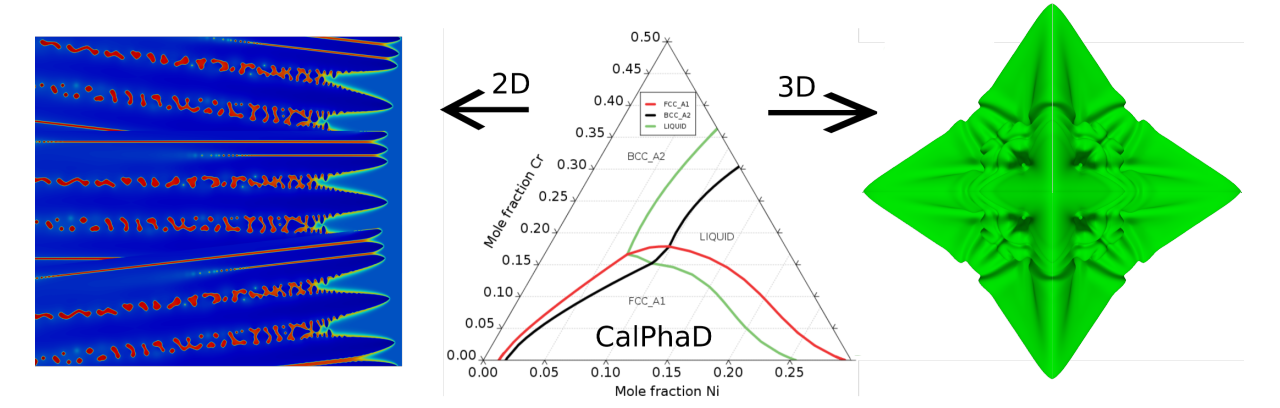
Solidification cracks during welding represent a complex, multi-scale, multi-physical challenge that requires a comprehensive understanding of the intricate interactions. Therefore, the FOR5134 project is carried out in close cooperation with 6 partner research groups from other renowned universities and research institutes in Germany. Our subproject tackles the problem at the microscale, focusing on dendritic solidification phenomena using multiple components and multiphase field simulations with Grandchem formulation. The aim of the microstructural simulations is to identify the factors and variables that influence microstructural solidification crack formation. This enables an accurate prediction of the solidification and segregation behavior as well as the crack probability in metallic welds under different processing conditions. A hierarchical multiscale approach is used to transmit critical data on temperature profiles and concentration distributions within the weld pool from the mesoscale to the microscale, using appropriate data interfaces to facilitate solidification simulations. For use in the simulations, the thermodynamic framework of the alloy is prepared using customized Gibbs energies from the CALPHAD database to perform simulations with realistic input data (see Figure 2).
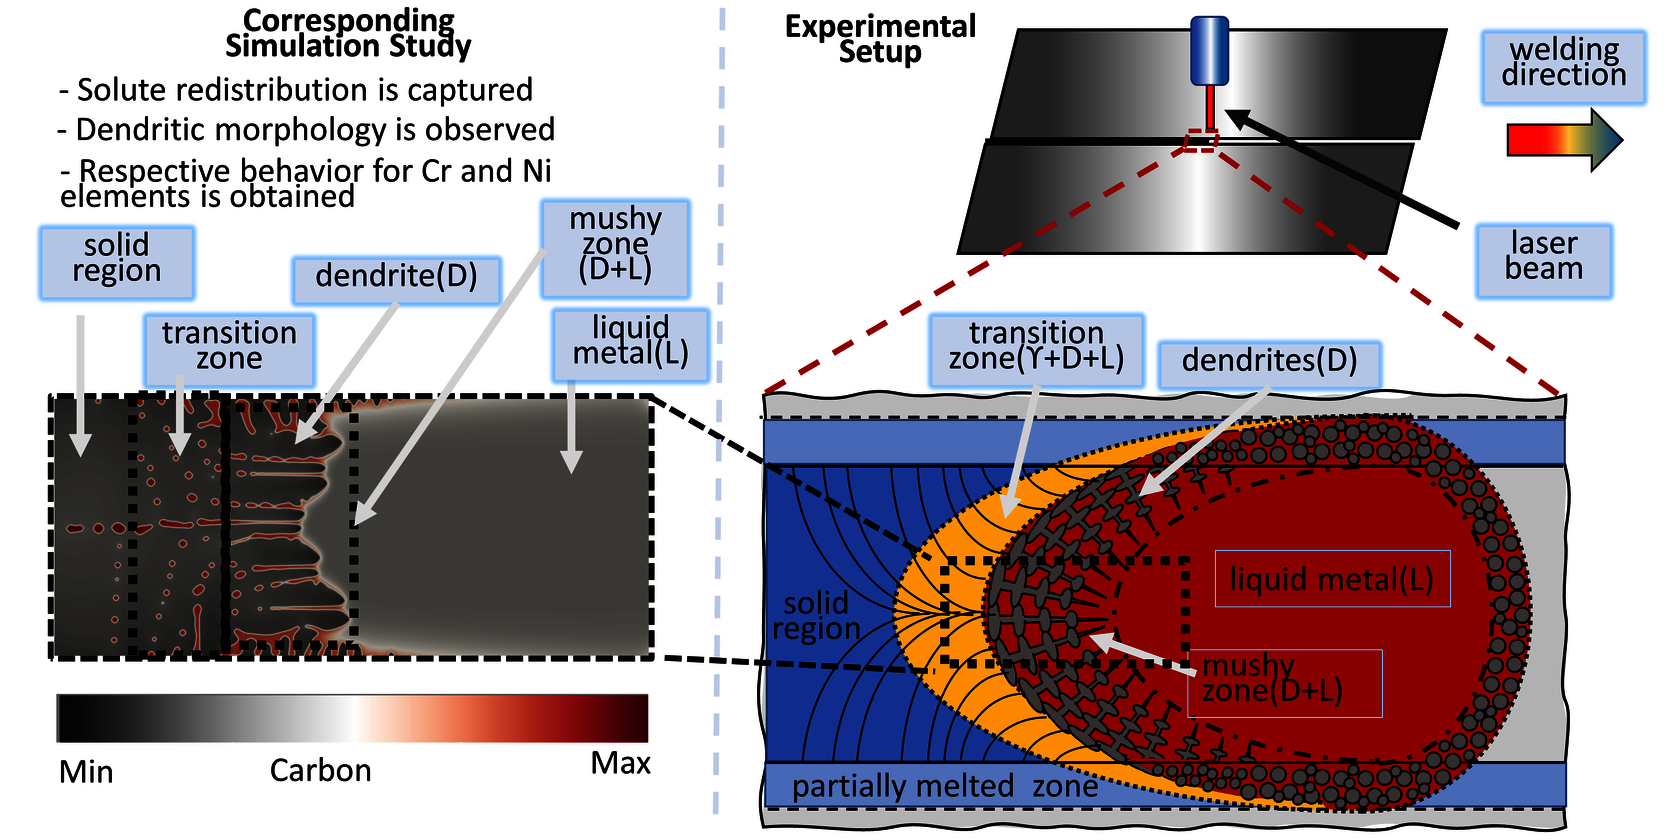
Coupled chemo-mechanical phase field simulations are used to model the progression of the solidification phases, including primary dendrite formation, dendrite blocking, grain boundary development and complete solidification, and to predict the potential formation of microcracks due to localized stress peaks. By resolving the microstructural evolution and incorporating local temperature variations, chemo-mechanical simulations provide insights into concentration, phase and stress distributions as well as future micro-crack patterns during solidification and segregation processes. In systematic investigations, process-relevant parameters such as the temperature gradient, the welding speed and the heat input are varied in order to evaluate their influence on the susceptibility to cracking at dendritic, grain or phase boundaries as well as in the heat-affected zone and in the melting area. The analysis of the simulated micro-crack distribution within the solidification structure provides statistical parameters relating to the distribution, proportion and formation rate of solidification cracks using data analysis algorithms. These findings from microscale simulations contribute to the theoretical understanding and categorization of metallurgically or mechanically induced solidification cracks by transmitting homogenized data to meso- and macroscale levels within a comprehensive multiscale framework. The first results in 2D already show promising observations predicting a critical region of the weld pool with a complex morphology of secondary dendrites, as shown in Figure 3.